The GOZH(geographically
optimal zones-based heterogeneity) model generates the optimal
spatial zone based on the binary classification of the decision tree and
then calculates the power of determinants.The LESH(locally
explained heterogeneity model) based on GOZH model and combined with
additive shapely theory to reasonably allocate variable interaction’s
power of determinants.In this vignette ,we use ndvi data in
gdverse package to demonstrate the spatial
heterogeneity explanation based on GOZH and
LESH model.
Load data and package
library(tidyverse)
library(gdverse)

data("ndvi")
head(ndvi)
## # A tibble: 6 × 7
##   NDVIchange Climatezone Mining Tempchange Precipitation   GDP Popdensity
##        <dbl> <chr>       <fct>       <dbl>         <dbl> <dbl>      <dbl>
## 1    0.116   Bwk         low         0.256          237. 12.6      1.45
## 2    0.0178  Bwk         low         0.273          214.  2.69     0.801
## 3    0.138   Bsk         low         0.302          449. 20.1     11.5
## 4    0.00439 Bwk         low         0.383          213.  0        0.0462
## 5    0.00316 Bwk         low         0.357          205.  0        0.0748
## 6    0.00838 Bwk         low         0.338          201.  0        0.549
Univariate power of determinants detection
gozh.uvi = gozh(NDVIchange ~ ., data = ndvi)
gozh.uvi
##                 GOZH Model
## ***          Factor Detector
##
## |   variable    | Q-statistic | P-value  |
## |:-------------:|:-----------:|:--------:|
## | Precipitation | 0.87255056  | 4.52e-10 |
## |  Climatezone  | 0.82129550  | 2.50e-10 |
## |  Tempchange   | 0.33324945  | 1.12e-10 |
## |  Popdensity   | 0.22321863  | 3.00e-10 |
## |    Mining     | 0.13982859  | 6.00e-11 |
## |      GDP      | 0.09170153  | 3.96e-10 |
plot(gozh.uvi)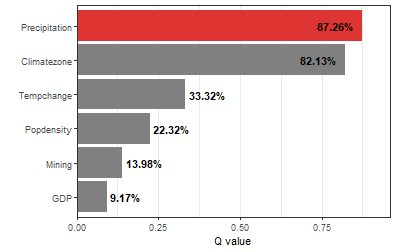
Variable interaction detection
gozh.bi = gozh(NDVIchange ~ ., data = ndvi, type = 'interaction')
gozh.bi
##                 GOZH Model
## ***        Interaction Detector
##
## |    Interactive variable     |    Interaction     |
## |:---------------------------:|:------------------:|
## |    Climatezone ∩ Mining     |    Weaken, uni-    |
## |  Climatezone ∩ Tempchange   |    Weaken, uni-    |
## | Climatezone ∩ Precipitation |    Enhance, bi-    |
## |      Climatezone ∩ GDP      |    Enhance, bi-    |
## |  Climatezone ∩ Popdensity   |    Enhance, bi-    |
## |     Mining ∩ Tempchange     |    Enhance, bi-    |
## |   Mining ∩ Precipitation    |    Weaken, uni-    |
## |        Mining ∩ GDP         |    Enhance, bi-    |
## |     Mining ∩ Popdensity     |    Enhance, bi-    |
## | Tempchange ∩ Precipitation  |    Enhance, bi-    |
## |      Tempchange ∩ GDP       | Enhance, nonlinear |
## |   Tempchange ∩ Popdensity   |    Enhance, bi-    |
## |     Precipitation ∩ GDP     |    Enhance, bi-    |
## | Precipitation ∩ Popdensity  |    Enhance, bi-    |
## |      GDP ∩ Popdensity       |    Weaken, uni-    |
plot(gozh.bi)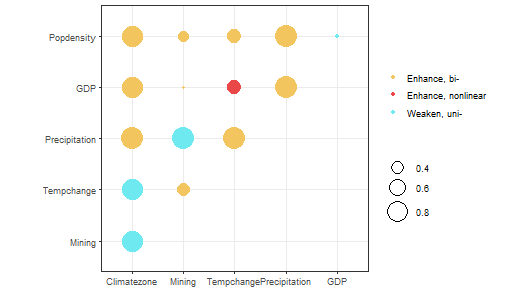
Variable interaction contribution
lesh.m = lesh(NDVIchange ~ ., data = ndvi, cores = 6)
lesh.m
## ***    Spatial Interaction Association Detector
##                      LESH Model
##
## |    Interactive variable     |    Interaction     |
## |:---------------------------:|:------------------:|
## |    Climatezone ∩ Mining     |    Weaken, uni-    |
## |  Climatezone ∩ Tempchange   |    Weaken, uni-    |
## | Climatezone ∩ Precipitation |    Enhance, bi-    |
## |      Climatezone ∩ GDP      |    Enhance, bi-    |
## |  Climatezone ∩ Popdensity   |    Enhance, bi-    |
## |     Mining ∩ Tempchange     |    Enhance, bi-    |
## |   Mining ∩ Precipitation    |    Weaken, uni-    |
## |        Mining ∩ GDP         |    Enhance, bi-    |
## |     Mining ∩ Popdensity     |    Enhance, bi-    |
## | Tempchange ∩ Precipitation  |    Enhance, bi-    |
## |      Tempchange ∩ GDP       | Enhance, nonlinear |
## |   Tempchange ∩ Popdensity   |    Enhance, bi-    |
## |     Precipitation ∩ GDP     |    Enhance, bi-    |
## | Precipitation ∩ Popdensity  |    Enhance, bi-    |
## |      GDP ∩ Popdensity       |    Weaken, uni-    |
plot(lesh.m, pie = TRUE, scatter = TRUE)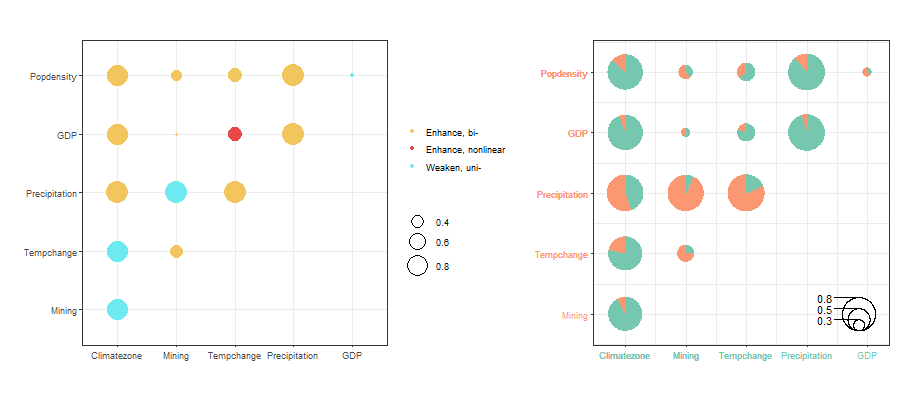
Compared to GOZH Interaction Detector , LESH only has a decomposition of the interactive contribution of variables,and the rest remains consistent.
gdverse supports modifications to the default ploting results, such as adding subfigure annotations and adjusting the size of the text on the x-y axis:
plot(lesh.m, pie = TRUE, scatter = TRUE,
     pielegend_x = 0.98, pielegend_y = 0.15) +
  patchwork::plot_annotation(tag_levels = 'a',
                             tag_prefix = '(',
                             tag_suffix = ')',
                             tag_sep = '',
                             theme = theme(plot.tag = element_text(family = "serif"))) &
  ggplot2::theme(axis.text.y = element_text(family = 'serif',size = 15),
                 axis.text.x = element_text(family = 'serif',size = 15,
                                            angle = 30,vjust = 0.85,hjust = 0.75),
                 axis.title = element_text(family = 'serif',size = 15))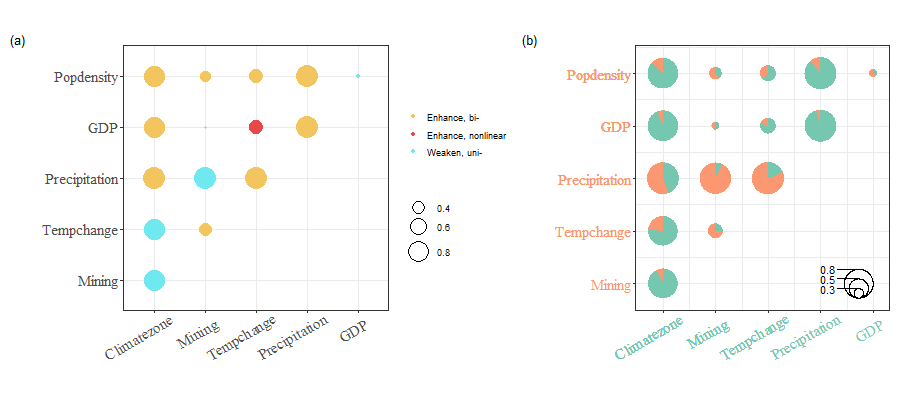
And you can only look at the contribution part of the variable interaction:
plot(lesh.m, pie = TRUE, scatter = FALSE)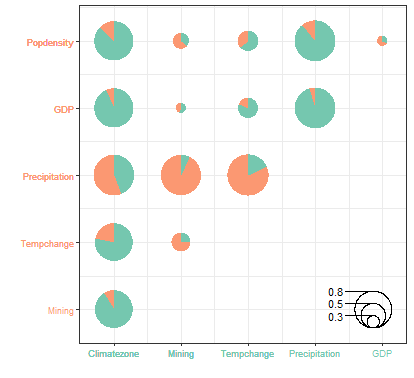
By accessing the concrete result through
lesh.m$interaction, which returns a
tibble.
lesh.m$interaction
## # A tibble: 15 × 8
## variable1 variable2 Interaction Variable1 Q-statisti…¹ Variable2 Q-statisti…²
## <chr> <chr> <chr> <dbl> <dbl>
## 1 Climatezone Mining Weaken, uni- 0.821 0.140
## 2 Climatezone Tempchange Weaken, uni- 0.821 0.333
## 3 Climatezone Precipitation Enhance, bi- 0.821 0.873
## 4 Climatezone GDP Enhance, bi- 0.821 0.0917
## 5 Climatezone Popdensity Enhance, bi- 0.821 0.223
## 6 Mining Tempchange Enhance, bi- 0.140 0.333
## 7 Mining Precipitation Weaken, uni- 0.140 0.873
## 8 Mining GDP Enhance, bi- 0.140 0.0917
## 9 Mining Popdensity Enhance, bi- 0.140 0.223
## 10 Tempchange Precipitation Enhance, bi- 0.333 0.873
## 11 Tempchange GDP Enhance, nonlin… 0.333 0.0917
## 12 Tempchange Popdensity Enhance, bi- 0.333 0.223
## 13 Precipitation GDP Enhance, bi- 0.873 0.0917
## 14 Precipitation Popdensity Enhance, bi- 0.873 0.223
## 15 GDP Popdensity Weaken, uni- 0.0917 0.223
## # ℹ abbreviated names: ¹`Variable1 Q-statistics`, ²`Variable2 Q-statistics`
## # ℹ 3 more variables: `Variable1 and Variable2 interact Q-statistics` <dbl>,
## # `Variable1 SPD` <dbl>, `Variable2 SPD` <dbl>Use lesh.m$spd_lesh to access the SHAP power of
determinants:
lesh.m$spd_lesh
## # A tibble: 6 × 2
##   varibale      spd_theta
##   <chr>             <dbl>
## 1 Precipitation    0.218
## 2 Climatezone      0.176
## 3 Tempchange       0.0482
## 4 Popdensity       0.0262
## 5 Mining           0.0158
## 6 GDP              0.0115